Using the Region Tools
You can use the Region tools to select a portion of an image.
Measurements of the region's perimeter or area can be shown with the annotation in 2D views and are also available in the lower section of the Data Properties and Settings panel (see Region Properties). Other parameters, such as the minimum, maximum and mean values of a dataset within the region, are available in region histograms (see Plotting Histograms from Annotations).
You can use any of the Region tools, as described in the following table, to select a portion of an image.
A number of editing options are available for regions. You can move regions, reshape rectangular and elliptical regions, as well as adjust the position of the control points that define the polygonal and freehand regions.
- Select the required region, either directly in the 2D view or in the top section of the Data Properties and Settings panel.
- Select any section of the region between its control points and then drag to reposition the annotation.
- Select the required region, either directly in the 2D view or in the top section of the Data Properties and Settings panel.
- Click and drag a control point to reshape the region.
The region measurements are updated automatically.
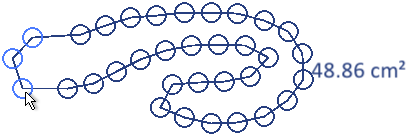
You can adjust a polygonal or freehand region by repositioning one or more of its control points.
- Select the required region, either directly in the 2D view or in the top section of the Data Properties and Settings panel.
- Click inside the control point or points you need to adjust and then drag.
The region measurements are updated automatically.
- Click inside the selected control point(s) to de-select it.
- Select the required polygonal or freehand region, either directly in the 2D view or in the top section of the Data Properties and Settings panel.
- Do the following, as required:
- Double-click the region between control points to add a control point.
- Double-click a control point to remove it from the region.
You can customize the appearance of regions and their captions in the Properties box, shown below.
Region properties

| Description | |
|---|---|
| Thickness | Indicates the thickness (in screen percentage) of the contour that defines the shape of the annotation, including its control points.
|
| Align text horizontally | Lets you set the horizontal alignment of the caption to the Left, Center, or Right of the annotation.
Note Not available if Floating caption is selected. |
| Align text vertically | Lets you set the vertical alignment of the caption to the Top, Middle, or Bottom of the annotation.
Note Not available if Floating caption is selected. |
| Show captions | If selected, a caption will appear with the annotation. Options include:
Perimeter… If selected, the computed perimeter of the region will be shown as the caption. Area… If selected, the computed area of the region will be shown as the caption. Custom… If selected, the caption entered in the Caption edit box will be shown. |
| Floating caption | If selected, the caption will appear in a floating box that can be repositioned manually anywhere within the view to avoid overlapping. |
| Font size and style | Lets you increase or decrease the font size of the caption with the Increase font size and Decease font size buttons, as well as choose a font style. |
| Control point size | Lets you set the size (in screen percentage) of the annotation's control points.
|
| Control point appearance | Let you choose a shape — circle, square, triangle, cross, or "X" — for the annotation's control points. |
| Region | Indicates the perimeter and area* of the selected region. Additional measurements for rectangles and ellipses include the following:
Rectangle… Includes length measurements of the short and long edges. Ellipse… Includes length measurements of the major and minor axes. Three-Point Circle… Includes diameter measurement. |
* Sub-pixel resolution, which can be used to measure within an accuracy that exceeds the nominal pixel resolution of an image, can be obtained in images that contain well-defined lines, points, or edges.
The following tools are available for plotting intensity values extracted from a selected image within regions.
| Description | ||
|---|---|---|
| Histogram |
|
Lets you plot intensity values within a region (see Plotting Histograms from Annotations). |
A number of configured actions and keyboard shortcuts are available for creating and editing regions. The default settings for these actions are listed in the following table.
| Action | Key | Mouse |
|---|---|---|
| Create an elliptical region in Ellipse mode | - | Left mouse |
| Edit an elliptical region in Ellipse mode | - | Left mouse |
| Create a freehand region in Freehand mode | - | Left mouse |
| Edit a freehand region in Freehand mode | - | Left mouse |
| Create a polygonal region in Polygon mode | - | Left mouse |
| Edit a polygonal region in Polygon mode | - | Left mouse |
| Create a rectangular region in Rectangle mode | - | Left mouse |
| Edit a rectangular region in Rectangle mode | - | Left mouse |
| Create circle from 3 points | - | Left mouse |
| Add or remove control points from paths and regions | Left Shift | Double-click |
| Switch to Circle from 3 Points region mode | - | - |
| Switch to Ellipse mode | - | - |
| Switch to Freehand mode | - | - |
| Switch to Polygonal mode | - | - |
| Switch to Rectangle mode | - | - |
